What they’re not saying about college admissions
Back in 2018, Stanford made a big announcement that they would stop releasing acceptance rates. Lots of publications picked up on it. They wanted students to focus on finding the right fit not trying to get into a selective school. Some people heralded it as the beginning of an era that would make the college admissions process less stressful for the teenagers (or more accurately the parents of teenagers) going through the process.
Since their announcement, a handful of other schools (Princeton, Cornell, Penn) have made similar decisions. They don’t release information about application numbers, etc. during the application process in an effort to reduce applicant stress.
The effort has done nothing to reduce applicant stress. Like so many decisions in the admissions process, their policy has gone a long way to help the schools feel like they’re doing the right thing without actually accomplishing what they say they wanted to accomplish. Fortunately, we still have math, and anyone with an internet connection can go to College Navigator and see what the school’s admission rate was the previous year. There is also a lot they’re not telling you about their admissions process.
The Real Numbers
Overall application numbers are up. Most selective universities haven’t started accepting significantly larger numbers of students. There’s a scarcity principle at work that the admissions office (and their alumni networks) don’t want to give up. So acceptance percentages are just a problem of the denominator getting larger while the numerator stays the same.
But that doesn’t tell the whole tale. When colleges start looking through their applicant pools, they are filtering the applicants through a list of institutional priorities. State flagship universities want to make sure they have representation from every county in the state. Other schools want to be sure they have students from all 50 states. If you’re a left-handed tuba player from Montana and that’s what Selective U is looking for, you’ve got an advantage.
In general terms, an applicant pool will break down into 3 groups: institutional needs, diversity initiatives, and “unhooked.” Being in either of the first two groups gives the applicant a “hook.” Because that applicant will satisfy a need for the university, that applicant will have an advantage in the admissions process. If an applicant doesn’t fall into one of those first two groups, they are “unhooked.” The majority of students are unhooked.
So what to these numbers mean in practical terms?
It’s tough to know. Colleges are very good about producing data on how many applicants they had and how many they admitted. They love to give us “class of” profiles that summarize lots of information about the students starting school each Fall. However, no real mechanism exists to perfectly calculate the number of applied to the number of accepted to the number of enrolled easily. At least not one that I can pursue through unfunded research.
Institutional Needs
Institutional needs will include all of the sports and academic teams a university has. The marching band, the yearbook, the newspaper. A large part of this group will be made up of athletes, legacies, developmental, and children of faculty. The group as a whole will have a much higher acceptance rate. Athletes are often “pre-read” by the admissions office or the coach knows exactly the threshold for a GPA and test score the player needs for admission. Since the Supreme Court decision in June of this year, legacy admissions are getting greater scrutiny and will probably be a target for diminishing advantages over the next few admissions cycles, but developmental applicants (applicants from families capable of making large donations to the university) will continue to have an edge. I mean, the Dean’s gotta’ eat, right?
At a selective university where the freshman class will be 2000ish students, the “institutional needs” group often makes up 25-30% of the class. At larger universities it will be a smaller percentage. Since larger universities also typically admit much more than 20% of an applicant pool, the institutional needs group doesn’t have the same impact on the overall acceptance percentages.
Diversity Initiatives
Diversity initiatives includes both admitting more students from traditionally underrepresented minority groups (Black, Hispanic, Native American) as well as international students. As Freddie DeBoer pointed out in our podcast conversation, international students are critical to a university’s bottom line. Based on “class of” profiles that schools release, it’s pretty easy to see that international students consistently make up 12-15% of a freshman class, and they are typically 10-20% of an applicant pool.
Colleges have made no secret of their desire to enroll more traditionally underrepresented minorities. While it remains to be seen how colleges are going to adjust given the Supreme Court decision from June, they have no plans to change those intentions. Based on “class of” data released in previous years, underrepresented minorities make up 25-30% of a class, and they typically make up about 30% of an applicant pool.
Taken together, the diversity initiatives can easily make up about 40% of an admitted group.
Unhooked Students
The one year I coached freshman football, the head coach used the term AYOs: all you others. He had “the starters, the backups, and then the AYOs.” In the college application pool, “unhooked” students are the AYOs. And they’re likely the majority of the applicant pool even though they’ll likely only make up about 30% of the accepted students.
The Practical Effect
If “institutional needs” makes up around 30%, “diversity initiatives” are 40%, and “unhooked” is 30%, what does that look like in an actual admitted class?
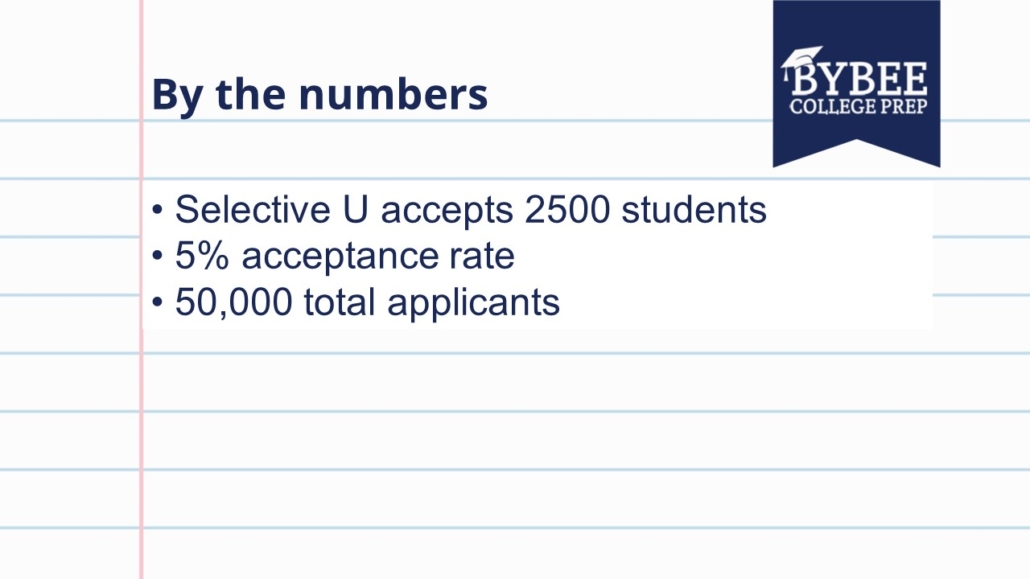
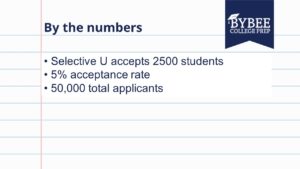
Let’s take a look using hypothetical Selective U. Let’s say that Selective U has a5% acceptance rate and wants to admit 2500 students each year. They know that 80% of the students they accept will enroll and they want a freshman class of 2000 students. Those numbers mean that they’re going to have an applicant pool of 50,000 students each year.
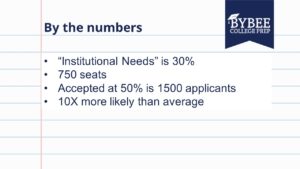
If “institutional needs” will make up about 30% of a freshman class, that’s 750 of the 2500 seats. Of course, that group likely enrolls at a slightly higher rate, but for the purpose of our math, we’ll keep it at 80%. For the purposes of our hypothetical situation, let’s also imagine that this group gets accepted at a 50% rate. Again, I would suggest the real rate is significantly higher, but there is no hard data.
Admitted at a 50% rate means that the “institutional needs” group makes up 1500 of the 50,000 applicants. And they’re getting admitted at 10 times the rate of the average applicant. That’s quite an advantage.
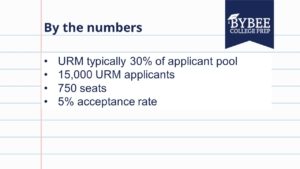
Underrepresented minorities make up about 30% of an applicant pool and about 30% of an enrolled group. The number can range from 25-30%, but it’s typically closer to 30 than 25. 15,000 applicants applying for 750 spots is a 5% admissions rate. In other words, a student from a traditionally underrepresented minority does not have an advantage over the average acceptance rate.
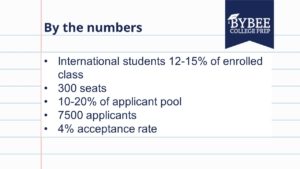
International students make up 12-15% of a class. If it’s 12%, it’s 300 seats. If they’re 15% of an applicant pool, they make up 7500 applicants, so about a 4% acceptance rate.
That Leaves Unhooked
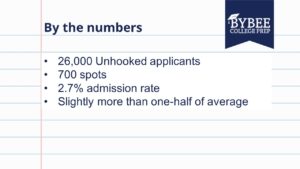
If you add up all of the applicants represented so far (1500 institutional needs, 15,000 underrepresented minorities, and 7500 international), you discover that you have 26,000 of the 50,000 applicants unaccounted for. Slightly more than half of an applicant pool is “unhooked.” Subtracting all the other spots, the admissions office has 700 seats left. 26,000 applicants competing for 700 seats is a 2.7% acceptance rate. “Unhooked” applicants have slightly more than one-half of the acceptance rate of Selective U’s average. It’s the world’s worst game of musical chairs.
What Can You Do?
For many parents in the unhooked situation, we recommend shifting their focus. Too often, we discover that college acceptances are being looked at as a trophy or an award for a student’s hard work. The student should still target those highly selective schools, but they should have a healthy list of less selective schools with quality programs on their lists as well.
The focus of the admissions process should be on finding colleges that are a good fit for a student. I often talk about a “top 1/2” strategy. If you’re lucky enough to get one of those 5% lottery tickets that gets you into an Ivy-plus school, fantastic, but most students applying, statistically speaking 95% of them, are going to get denied. A much better strategy is focusing on schools where you know your academic profile puts you in the top half of students the day you walk on campus. That is going to lead to more leadership, internship, and research opportunities at that school which in turn will lead to better outcomes.
You might take it a step further and consider honors programs at universities that offer them. The average SAT scores for students in honors programs at state flagship universities is very often the equivalent of the average at Ivy-plus schools. You can shift your focus to a more selective program within a less selective school and reap at least the same benefits you would have had at Selective U.
We offer a free introductory consultation to help you map out your college admissions plan. Meet with us for 30-45 minutes and get a better picture of what you need to do.