
How to Use the Common Data Set in Your College Search
Most families don’t realize the single most useful admissions resource is publicly available — for free. It’s called the Common Data Set (CDS), and it’s the “most helpful three words” you can learn as you start the college search process.
The CDS is a goldmine of admissions data: how many students applied and were accepted, what quartiles those students came from, what test scores schools prioritize, and even what criteria a university values most in its evaluation process. The best part? Every participating university presents the information in the same format, making it easy to compare schools.
In this article, we’ll walk through how to use the Common Data Set effectively, using Texas A&M’s most recent CDS as an example.
What the Common Data Set Is
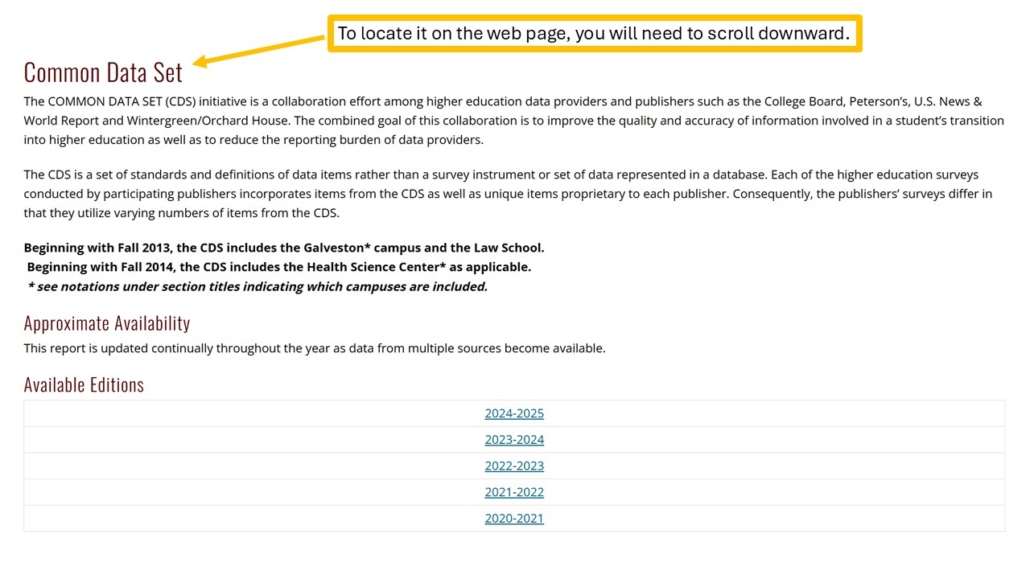
The Common Data Set is a standardized report that universities voluntarily publish each year. It’s designed to give prospective students and families consistent, reliable information about admissions and enrollment.
That said, it’s not always easy to find. The CDS is often buried deep in a university’s institutional research or planning office webpage. For example, Texas A&M’s CDS can only be found with a targeted Google search like “Texas A&M Common Data Set 2023.” Once you know where to look, however, it becomes one of the most powerful tools in your admissions research.
 Admissions and Waitlist Numbers
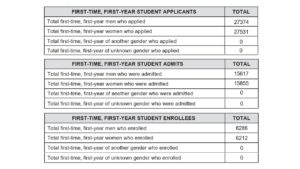
One of the first things you’ll see in the CDS is admissions totals: how many students applied, how many were admitted, and how many ultimately enrolled.
For Texas A&M’s Fall 2023 freshman class:
-
Applicants: ~55,000
-
Admitted: ~31,000
-
Admit rate: ~56%
You’ll also find details about waitlist offers, how many students accept spots on the waitlist, and how many eventually enroll. This helps you gauge whether a university regularly uses its waitlist as part of admissions strategy.
 What Colleges Value Most in Admissions
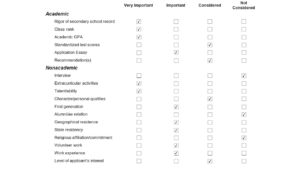
Another important section of the CDS shows how heavily each school weighs different parts of an application. Factors are ranked as “Very Important,” “Important,” “Considered,” or “Not Considered.”
For example, one school may emphasize GPA and class rank, while another places more weight on essays, recommendations, or extracurriculars. Knowing what a school values most helps students focus their effort strategically — whether that means polishing essays, preparing for interviews, or highlighting leadership roles.
 Making Sense of GPA Data
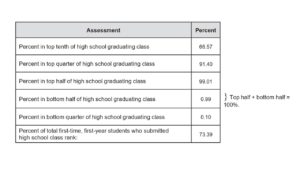
Here’s where the CDS becomes truly eye-opening. Unlike GPA, which can vary dramatically from one high school to another, class rank quartiles tell a much clearer story.
At Texas A&M in Fall 2023:
-
Nearly two-thirds of admitted students were in the top 10% of their high school class.
-
Over 90% were in the top quartile (top 25%).
-
Less than 1% were in the bottom half of their graduating class.
Put another way: of the 55,000 applicants, only about 310 students admitted were from the bottom half of their class. That’s a 0.5% chance of admission if you aren’t in the top half.
This is the reality families need to understand. At highly selective schools like Texas A&M, being competitive often starts with being at the very top of your high school class.
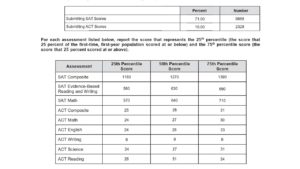
Using SAT & ACT Score Ranges
The CDS also breaks down SAT and ACT scores by section (Math, Reading, Composite), and shows the middle 50% range of admitted students.
Here’s how to use that data:
-
Inside the middle 50%: If your score is in this range, you should submit it. For example, if a school’s middle 50% SAT range is 1300–1400 and you scored a 1320, that helps demonstrate you’re right where they expect.
-
Above the median: Submitting the score will likely help your application.
-
Below the 25th percentile: At test-optional schools, withholding the score may be the better strategy.
It’s important to note: if you don’t submit scores, schools don’t assume you were “just below” the median. They assume your scores were much lower — maybe closer to 1150 instead of 1320. That’s why, when in doubt, submitting scores in the middle 50% is usually the safest bet.
Why the CDS Is a Game-Changer
The Common Data Set makes admissions transparent. It helps families cut through the myths and anecdotes and instead rely on real data: admit rates, class rank breakdowns, test score ranges, and evaluation priorities.
It also helps you build a smarter college list. If you know your academic profile, you can quickly see where you’re in line with a school’s admitted students — and where you’re not. This is the foundation for determining reach, target, and safety schools.
At Bybee College Prep, we use the CDS with every student to build personalized, strategic college lists. It’s one of the best ways to make sure families are setting realistic expectations while keeping every possible opportunity on the table.
Final Thoughts
The Common Data Set is an invaluable tool — but only if you know how to use it. From understanding how selective a school is to gauging where your scores and GPA fall, the CDS gives you the transparency you need to plan effectively.
👉 Want expert help interpreting the Common Data Set for your student’s profile? Schedule a free consultation today.